IRMA is the innovative ensemble-centric platform that enables users to do analytics, reservoir management and optimization work using ensembles of models. It makes it easy and straightforward to work with the 100’s of realizations of uncertainty-centric modeling.
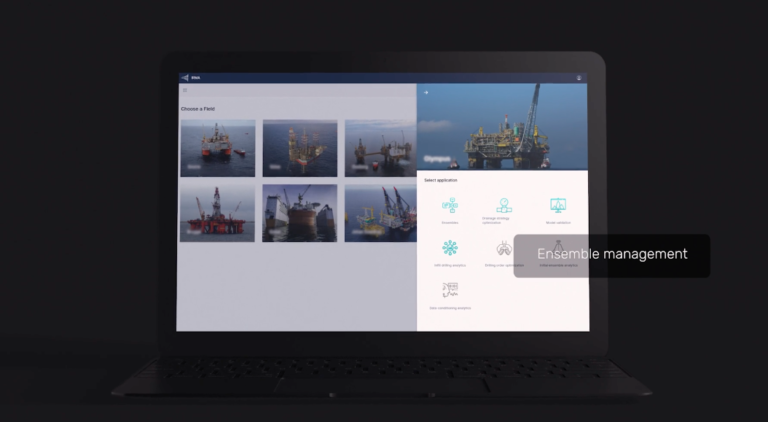
IRMA offers a dedicated platform that ingests and manages your ensemble data, whether it comes from ResX or from other ensemble sources.
Applications in IRMA deploy analytics, data exploration, machine learning, optimization and visualization techniques to enable you to easily use ensembles of models to explore the subsurface, identify new opportunities and understand their associated risks.
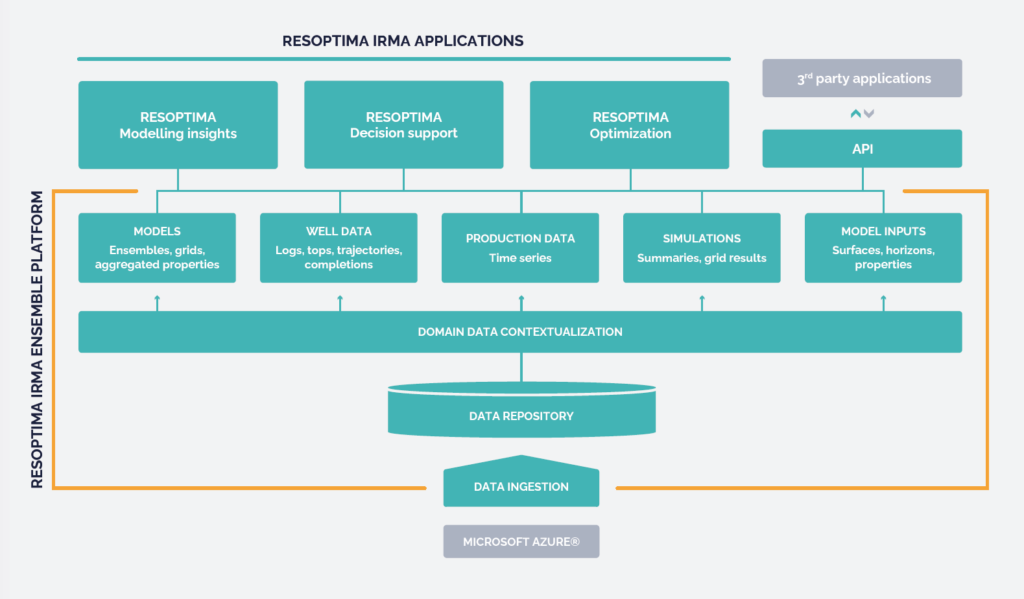
An open API allows third party applications to connect to data sources and use the ensembles with a microservice-oriented architecture which is deployed in a cloud environment.
A platform to manage ensemble models
Ensemble-based modeling is recognized as the best process to model the subsurface, perform the simulations and history-matching and use this to predict future reservoir performance. However the existing platforms managing the subsurface and engineering data are designed to manage individual models, and it is therefore very cumbersome to work with the hundreds of realizations typical of ensemble workflows. IRMA is a purpose-built platform that manages ensembles as explicit data items, simplifying work with one or multiple ensembles. Tools are available to manage, analyze and evaluate ensembles.
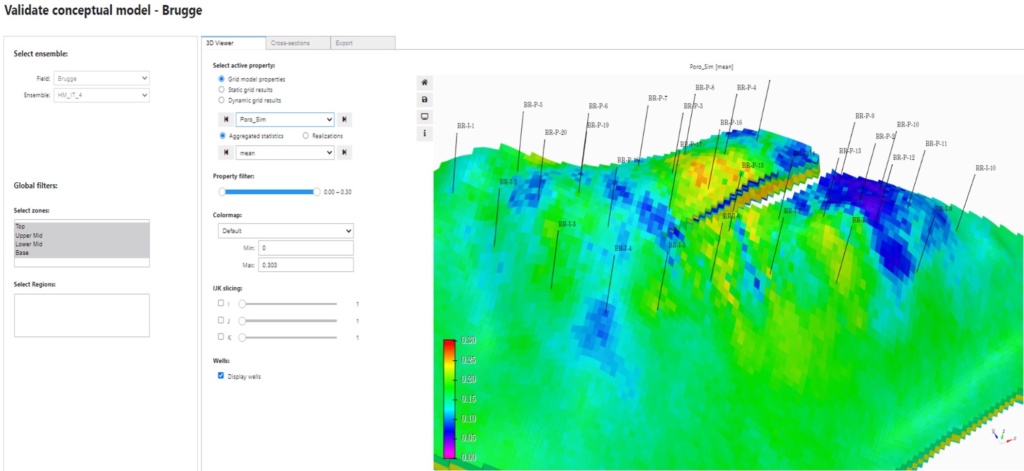
Single ensemble analysis
The hundred or so realizations that together constitute an ensemble model go through a number of iterations from the initial or prior model to the posterior model. Knowing e.g. how the Kalman smoother went about adjusting the model at each iteration to perform history matching effectively can help validate an ensemble.
Descriptive qualitative analysis
Ensemble modeling is very rich in information beyond the plotting and statistics of the realizations. IRMA offers a comprehensive suite of tools to perform an in-depth assessment of an ensemble, the factors that were at play through the multiple history-matching iterations and many other insights.
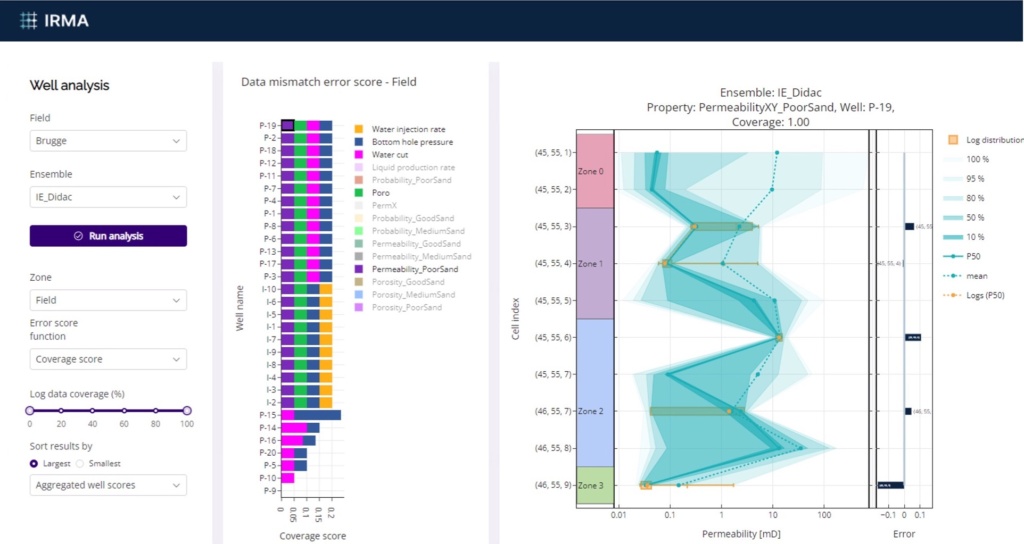
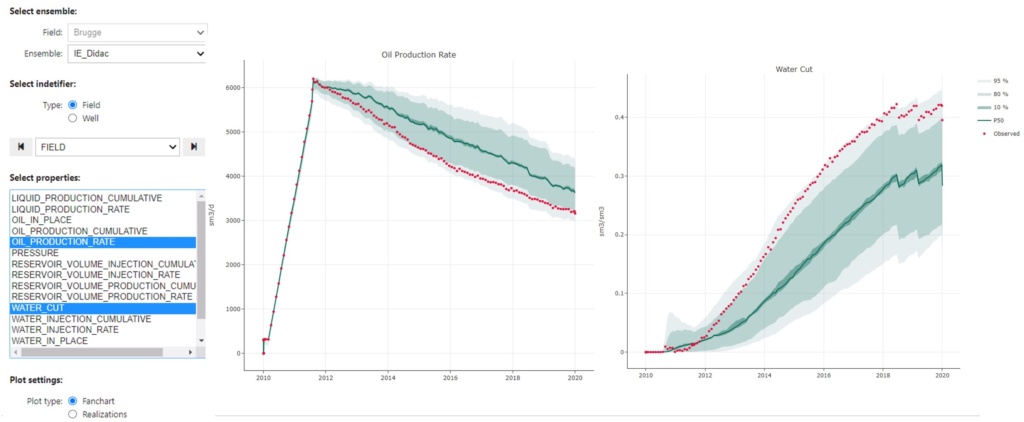
Descriptive quantitative analysis
IRMA makes the plotting and reporting of aggregated properties faster and simpler to communicate. In traditional platforms, this is often cumbersome and time consuming, making it difficult to understand the aggregated results.
Dual ensemble analysis
IRMA provides a rich set of tools to compare different ensembles and understand the underlying elements that drive the differences. With efficient tools to select, visualize and analyze the ensembles and the changes in scalar variables from one to another, the comparison of outcomes for projected activities such as infill drilling or injection for EOR becomes the basis to make a fully-informed decisions inclusive of risks and uncertainties.
Comparing ensembles
Probabilistic and delta maps of chosen ensembles, with plots that focus on the areas where major changes have occurred associated with a simple way of knowing what ensembles are being compared.
The requirements for two ensembles to be comparable are:
- The modelling grids have the same resolution
- The zonation definition is the same for both ensembles
- Both ensembles have been simulated
- The facies definition is the same for both ensembles
- Both ensembles contain at least one 3D grid property
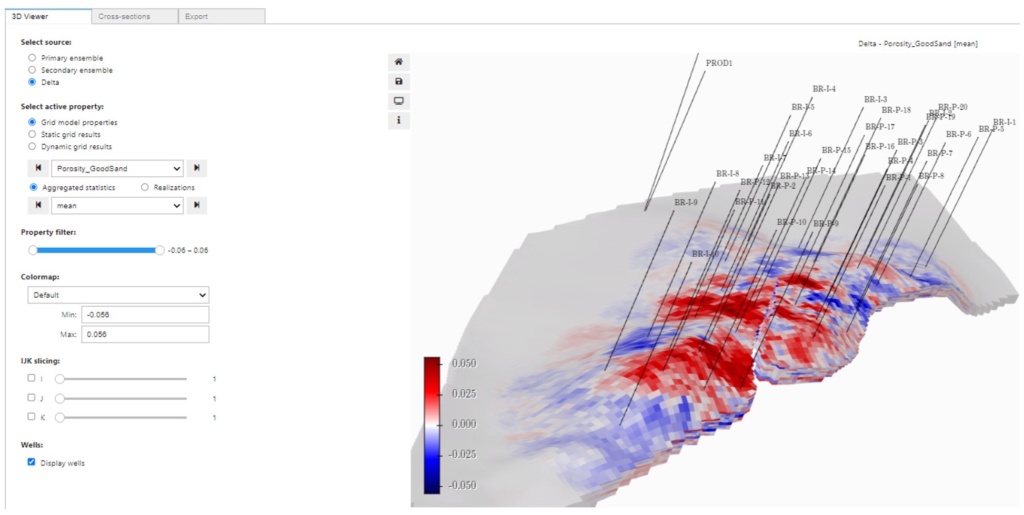
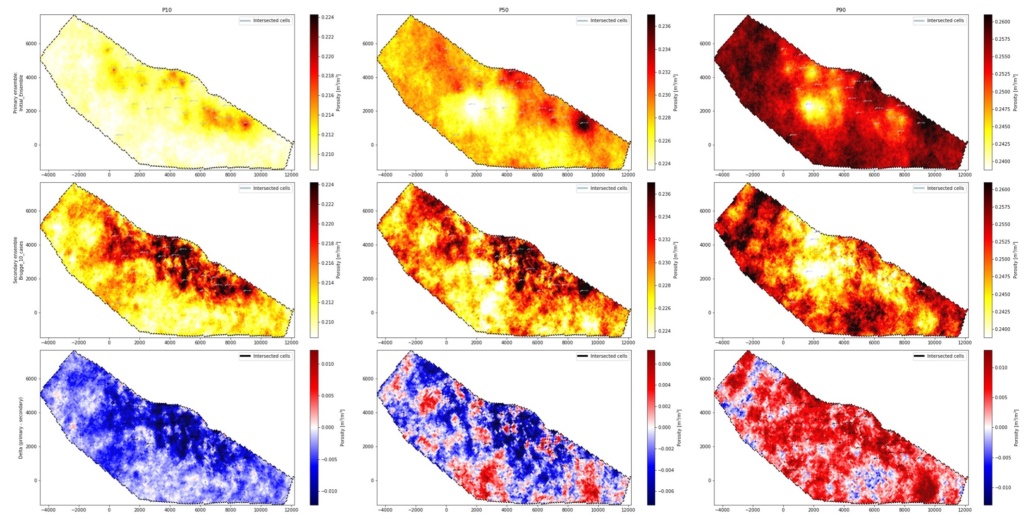
Delta analysis
Delta analysis grid properties generates a detailed spatial overview of where the changes are occurring. It generates the aggregated P10, P50 and P90 statistical maps for the primary and secondary ensembles together with the calculated difference maps. The delta 3D grid highlights areas where major changes have occurred and has plenty of filtering options to make the analysis even easier.
Delta plot
The statistics for an ensemble are represented by a time series made up from percentiles for the respective summary vector at each time-step in the simulation. The delta statistics then computes the difference in the same percentiles between the two ensembles.
Learnings
The delta analysis grid properties improve geological understanding. They get the user thinking of possible development scenarios and give insights to optimize the field.
The delta analysis summary results improve the understanding of production responses and open decision making options for planning and developing the field.
Plan and decide

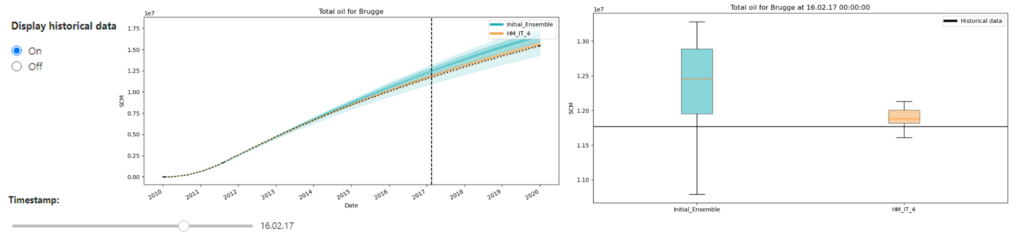
Infill drilling analytics
Applying AI, IRMA is capable of advising on how to schedule activities to maximize production and mitigate risks, for the most economically advantageous result.
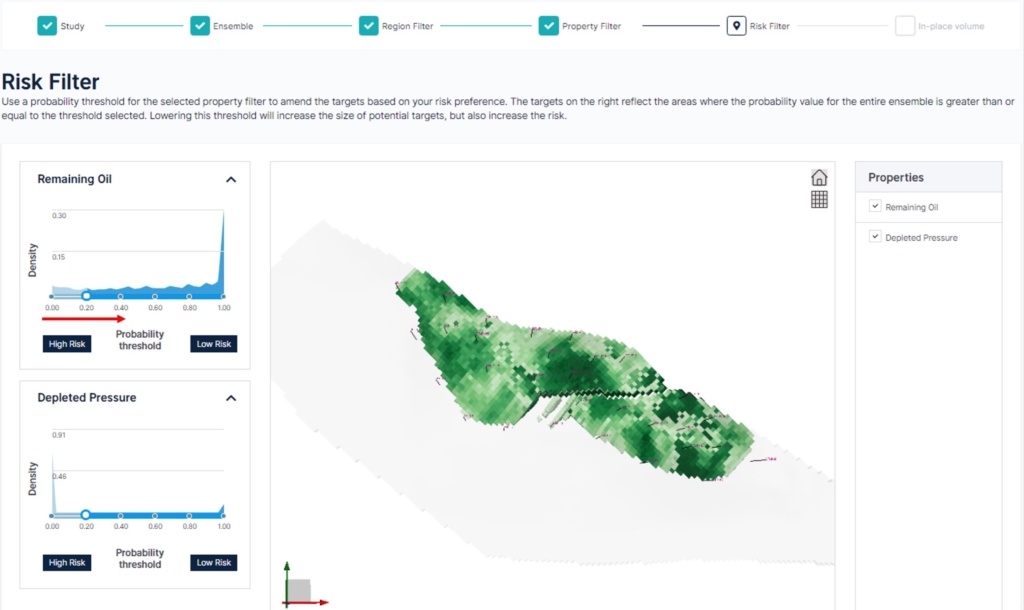
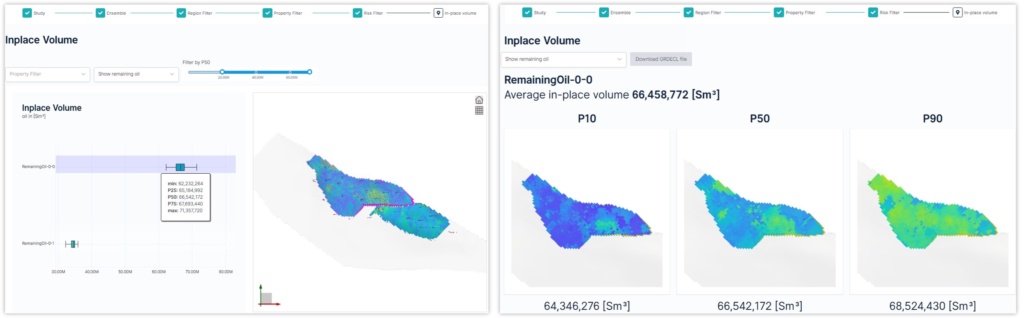
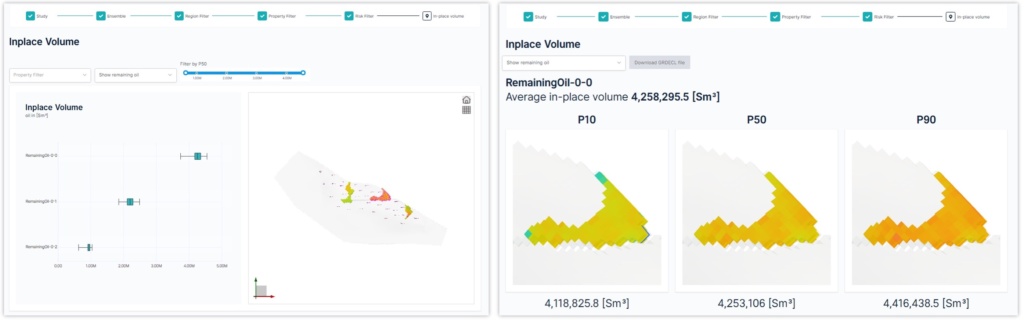
How to place infill wells
Once calculated, the box plot for each potential target area will be shown on the left-hand side. Filter the potential targets by defining the min/max P50 volume ranges. Hover over the box plot to see the statistic distribution of the inplace volumes and highlight the corresponding target area on the interactive map.
Clustered ensembles
When you have run an analysis in a specific area of a field, for example an Infill Drilling study, you might want to reduce simulation run time while evaluating the potential economic benefit of placing a well in an identified target region. For that purpose the Create clustered ensemble infill study app will facilitate that selection.
IRMA Lab
IRMA offers an open API for third party vendors as well as developers at our clients. This makes it possible to create new fit-for-purpose applications to address an asset team’s specific modeling and decision requirements. More on IRMA Lab here.
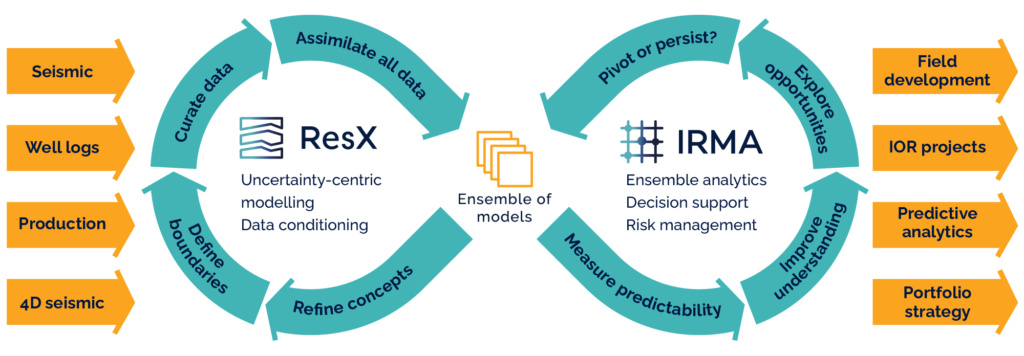
Seamless integration with ResX
IRMA automatically ingests and manages ensemble data from ResX. Together ResX and IRMA deliver speed, control and power, immediately assessing how modeling choices and data interpretation affect the resulting ensembles of models. This makes it possible for teams to quickly iterate and continuously learn and improve.
ResX and IRMA deliver an uncertainty-centric approach based on an end-to-end integrated and automated workflow that quickly closes the loop between input data and ensemble, providing analytics for insights and decision support.
Training
There are two training courses for IRMA:
Introduction: IRMA modules 1 to 3 – Intro & data management | Single ensemble analysis | Dual ensemble analysis
Advanced: IRMA modules 4 to 6 – Plan and decide | Drainage strategy optimization | IRMA Lab